Why Family Offices Should Fight the Urge to Cut Back on Small Buyouts
By Marc J. Sharpe, Natalie Walker, Daniel Krikorian and Michael Venne
As inflation rages, and central banks raise policy rates, concerns about the health of the economy have been front of mind for investors. Although the U.S. has so far managed to avoid a recession, many consumers and investors are now hunkering down.
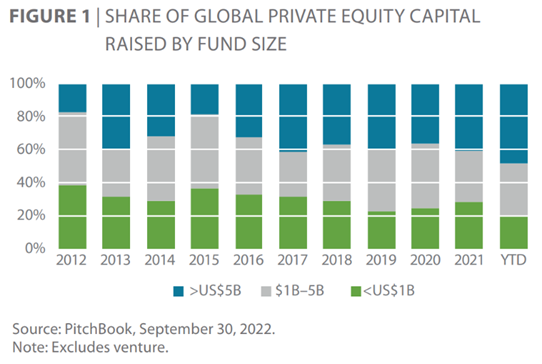
When the economy shrinks, consumers typically respond by paying down debt, saving more, and spending less on nonessential goods. Institutions, on the other hand, try to adjust the “tilts” of their portfolios. They increase their allocations to defensive assets like real assets and private debt, and seek ‘safety’ with larger, more familiar private equity fund managers. Necessarily, this comes at the expense of small, emerging, and diverse managers, which some regard as riskier than their larger, “more proven” counterparts (Figure 1).
The institutions that reduce their allocations to private equity’s small market managers during turbulent markets treat this tranche of the buyout market as a luxury good, something that is consumed when the economy is booming. Instead, we believe investors should consider it a staple that can bolster and diversify their portfolios regardless of the macroeconomic backdrop.
As global investors contemplate their 2023 budgets and allocation targets, they should resist the temptation to pull back on small-market buyouts. Contrary to what LP actions would imply, now is the time to lean in on the low(er) end.
Why Now May Be the Time to Lean In
The segment of the market we refer to as small-market buyouts (“SBO”) consists of private equity GPs that raise funds smaller than US$1 billion while investing in companies with a total enterprise value (TEV) of US$250 million or less. Although there are several benefits to investing in SBO, we have chosen to highlight the ones that are most salient to current market conditions.
VAST OPPORTUNITY SET YET UNDERALLOCATED
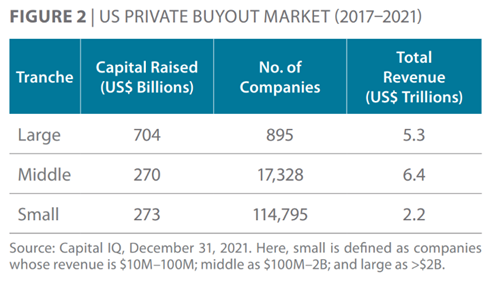
The SBO market is the largest and most dispersed tranche of the buyout market. In the US, which has the largest and most mature SBO market, it is significantly larger than the middle and large markets combined based on number of companies (Figure 2). In fact, the small market is home to nearly 90% of private companies in the US yet represents only a fifth of the capital raised. Family Offices’ propensity to cut back on SBO during downturns means there will be even less capital chasing the segment.
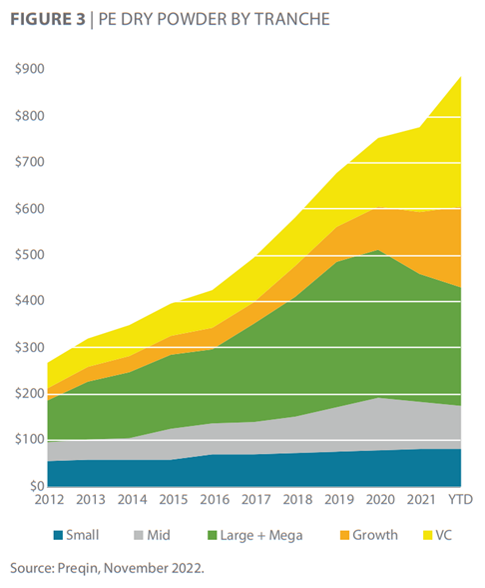
As seen in Figure 3, SBO dry powder has increased modestly compared with other strategies, growing at a CAGR of 3% between 2016 and 2021. While the trend lines for each have been up and to the right across the entire buyout market for many years, SBO has been most insulated from this frothiness.
GREATER FOCUS
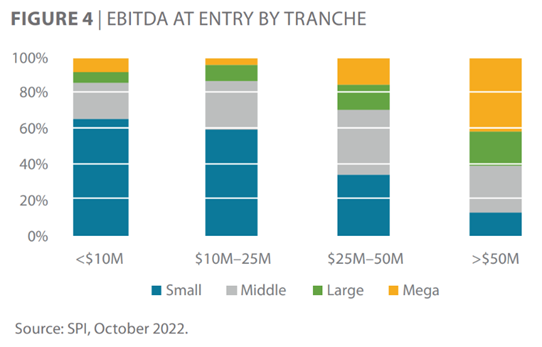
Most SBO funds target businesses with less than US$25 million of EBITDA, (Figure 4). Businesses of this size are less likely to be represented by sophisticated intermediaries (if they are represented at all), enabling SBO managers to source investments in a less competitive environment. By sourcing directly, SBO firms generate value from price inefficiencies, improved asset selection, and greater awareness of the true operational value-add potential of a business.
LESS LEVERAGE
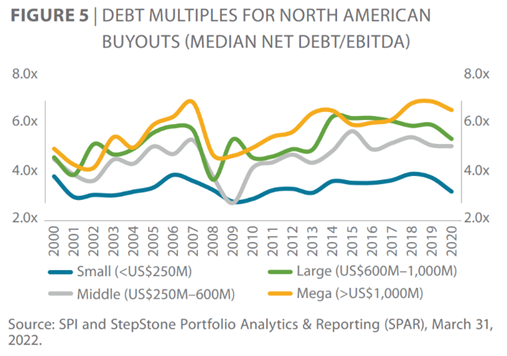
As seen in Figure 5, which illustrates leverage multiples for various tranches of the buyout market, small-market companies have used considerably less leverage than their larger counterparts. Because they have less debt to pay down, small-market companies have more free cash flow to reinvest in their businesses.
MULTIPLE EXPANSION
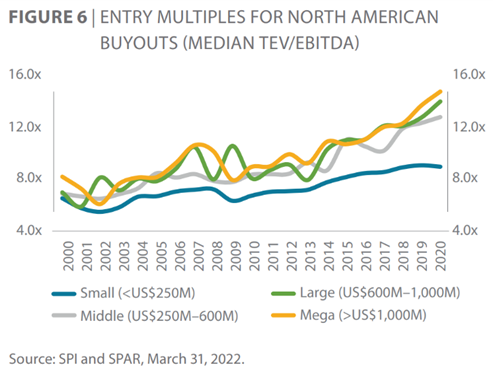
Historically, purchase price multiples have been much lower for small-market companies (Figure 6). And while the low-interest- rate environment that has characterized the past 15-plus years has allowed valuations to increase for all assets, entry multiples for small-market companies have risen more modestly.
Low entry multiples and a greater capacity for operational improvements create ideal conditions for multiple expansion. Harkening back to Figure 3, ample dry powder, particularly upmarket, suggests the pool of potential buyers is well funded.
“HOME RUN” POTENTIAL
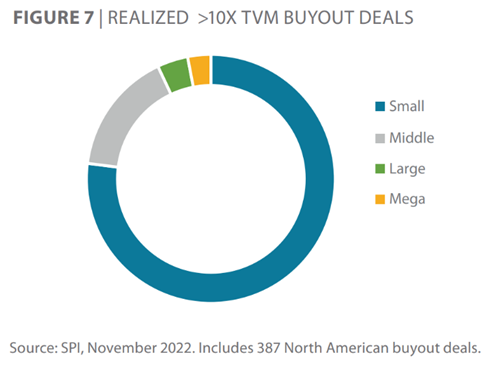
Large sponsor interest in high-quality assets that can serve as a platform for consolidation of high-growth or fragmented sectors can lead to home run deals. Of the 387 realized North American buyout deals tracked for this whitepaper that have generated a 10x outcome or better, 77% were in SBO funds (Figure 7).
While multiple expansion can certainly boost an outcome from good to great, it’s not required to generate strong returns given the other value creation levers available in the small market.
In response to questions around the sustainability of multiple expansion as a source of return, one should ponder the impact on both existing and new deals. While the range of potential multiple expansion may compress on existing deals, valuations for new deals have also compressed, providing the same opportunity for multiple expansion in the future. Simply put, multiple expansion is a feature of the valuation environment and competition (read: dry powder) at different segments of the buyout market, which we believe positions SBO well for the foreseeable future.
SENSITIVITY TO PUBLIC MARKET VOLATILITY
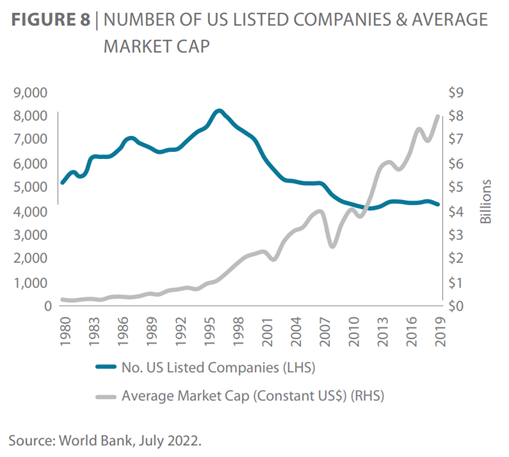
Adding private markets to a traditional portfolio provides exposure to assets that may be underrepresented in listed markets. Over the past 30 years, the size and composition of listed markets have changed markedly. As seen in Figure 8, the number of public companies has fallen by half. At the same time, the average market cap has grown markedly, suggesting the number of public micro- and small-cap companies has fallen as well. Investors building well-rounded portfolios are therefore looking increasingly to the private markets to gain small-cap exposure. Moreover, because small-market companies are underrepresented in stock markets, they are less sensitive to swings in the stock market than larger companies.
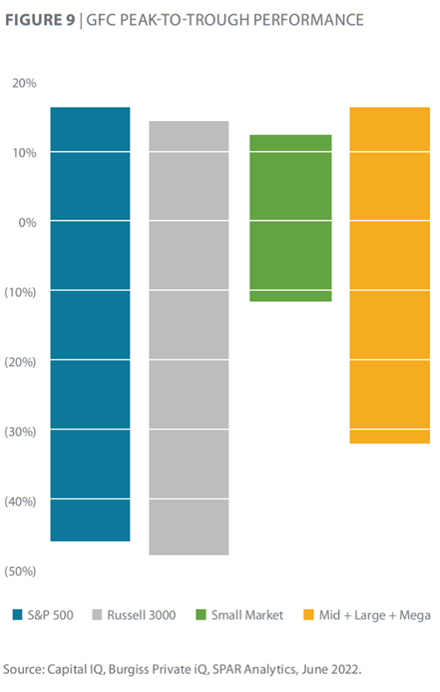
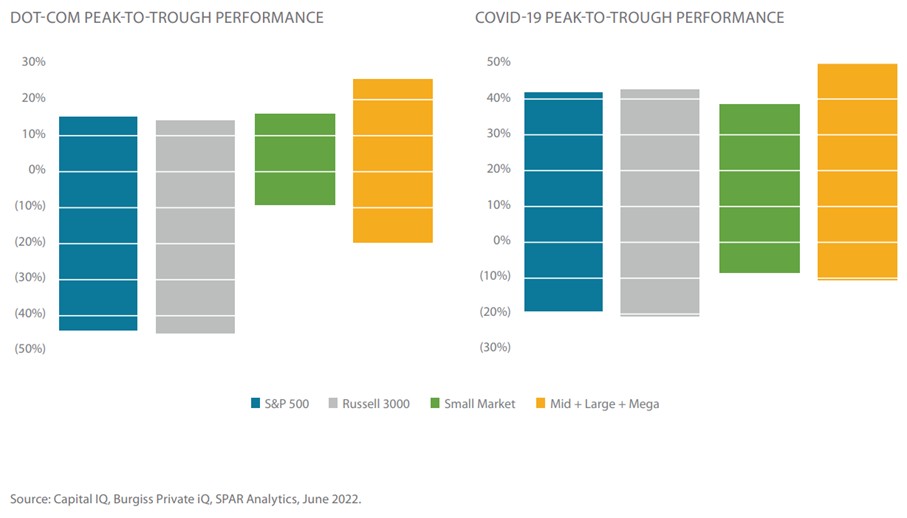
To get a sense of just how sensitive, we compared the peak-to-trough performance of mega, large, middle and SBO funds with the public markets’ during three crash and recovery cycles: the dot-com bubble, the Global Financial Crisis (GFC) and Covid-19. We refer to this analysis as upside/downside capture.[1]
Figure 9 illustrates the market capture during the GFC. As you can see, SBO valuations rose 13.7%, capturing 91% of the gains in the public markets, on average. By contrast, mid, large, and mega fund valuations rose by 15.2%, in line with the public benchmarks. However, upside is only half of the picture. To get a sense of how the two tranches performed during the entire cycle, we also examined the downside. From their peak at the end of September 2007, SBO valuations fell by 12.6%, roughly 75% less than either public benchmark. Mid, large, and mega fund valuations, by contrast, fell by more than one-third, capturing closer to 70% of public market downside. These results were consistent across all three cycles. On average, we found that SBO captured 30% of market downside and 94% of upside. This seems to run contrary to the popular assumption that SBO is riskier than other buyout strategies. How can this be?
Several factors may explain why small-market funds are less sensitive to fluctuations in equity markets.
1. Because the preponderance of small-market companies are privately held, there are fewer comps in the public markets.
2. SBO funds are generally more conservative in marking up businesses despite mark-to-market accounting. Mega and large buyout funds are more visible (some GPs even public themselves) and possibly held to more stringent accounting standards.
3. Large buyout managers tend to come back to market sooner, often raising capital for alternative strategies or products or both. Therefore, interim returns matter. This speaks more to upside capture.
4. SBO funds depend more on carry than management fees, which are calculated from a smaller basis. Small-market managers generally care more about exits than interim marks.
SBO Can Offer Great Access to Diverse Buyout Managers
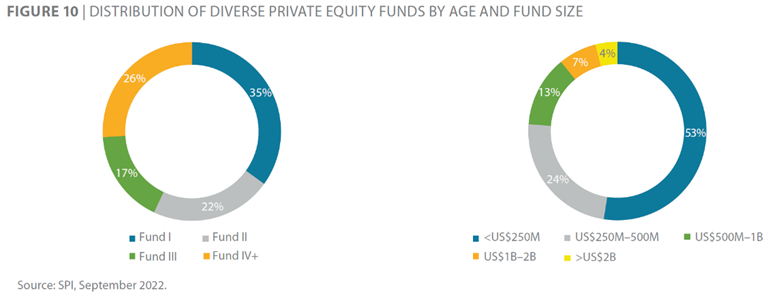
We define a diverse fund as one that passes the “33% test.”[2] Of the 1,400-plus North American buyout managers tracked by SPI,[3] 128 have raised a fund that passes this test. SBO managers account for one hundred of them. As seen in Figure 10, diverse managers not only skew smaller but younger as well. Nearly three-quarters of diverse-managed private equity funds are new or emerging, and 90% are smaller than US$1 billion.[4]
A substantial body of work examining the effect diversity has on decision-making, organizational health and investment performance has emerged. For example, A 2021 study by the National Association of Investment Companies found that diverse private equity funds beat the Burgiss median across several key performance indicators: net IRR, MOIC and DPI.[5]
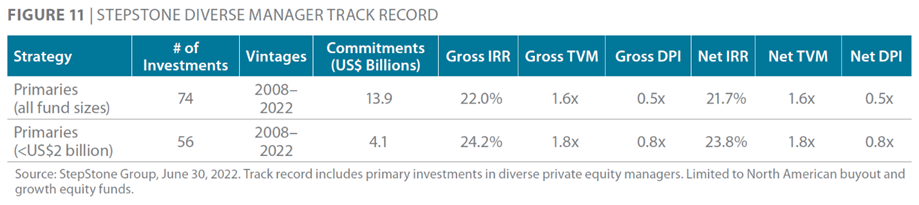
We have observed similar outcomes in our diverse manager track record (Figure 11).
· For primary buyout and growth equity funds, diverse managers’ net TVM of 1.6x outperforms the benchmark median of 1.49x over the same vintages.[6]
· This outperformance has been concentrated in the lower end of the market, where funds raising less than US$2 billion have generated a net TVM of 1.8x.
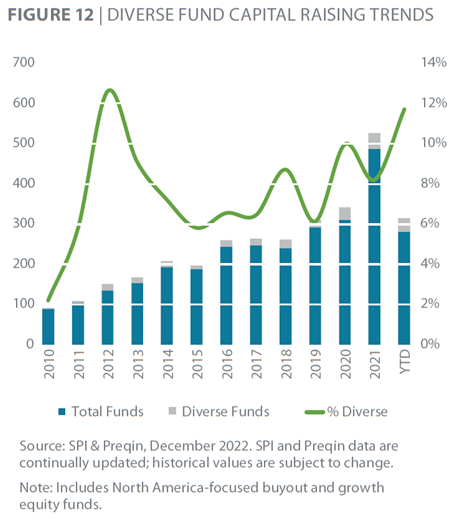
Notwithstanding these impressive returns, Family Offices have historically underweighted SBO where 90% of diverse talent exists. That said, the number and share of diverse funds has been increasing (Figure 12).
Though promising, it all feels a bit too frail. Unless Family Offices back enough of them, and diverse GPs consistently deliver competitive returns, few will survive, let alone graduate. Until that happens, SBO is buyout investors’ best / only realistic choice.
Challenges & Solutions
For all its benefits, SBO can present Family Offices with some challenges. It has more managers than any other segment of the buyout market. That many of these GPs are new or emerging means there are a lot of unproven teams and track records to decipher. Moreover, the difference between first- and fourth-quartile managers is widest for SBO.
The importance of manager selection is a common refrain in private markets. Within buyouts, this axiom rings truest for SBO funds, which have exhibited the highest and lowest return potential relative to other tranches (Figure 13).
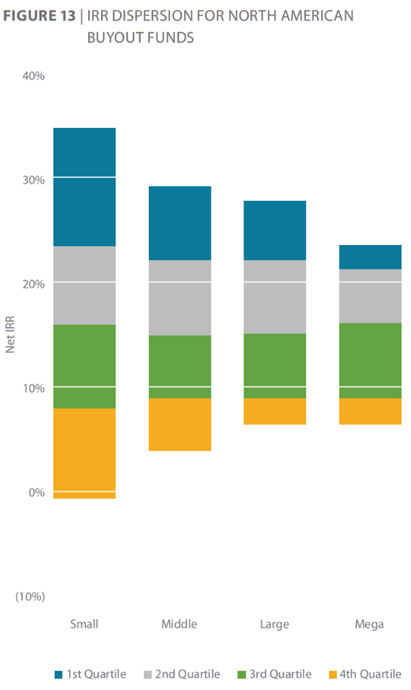
Not only are the inter-quartile spreads widest for SBO, but they also have the widest average “intra-quartile” spreads.
When comparing SBO managers, quartile may be too coarse a measure; family offices and their advisors might consider thinking in terms of deciles.
Unless a family office has significant resources in-house, attempting to cover the small market can feel like a tall order, and they might feel tempted to default to brand-name managers. But is it worth it to try?
INCREMENTAL EFFORT
To help family offices determine whether they should attempt to dedicate resources toward SBOs, we compared the hypothetical spread of performance one might expect from assembling portfolios of either brand-name or SBO funds.
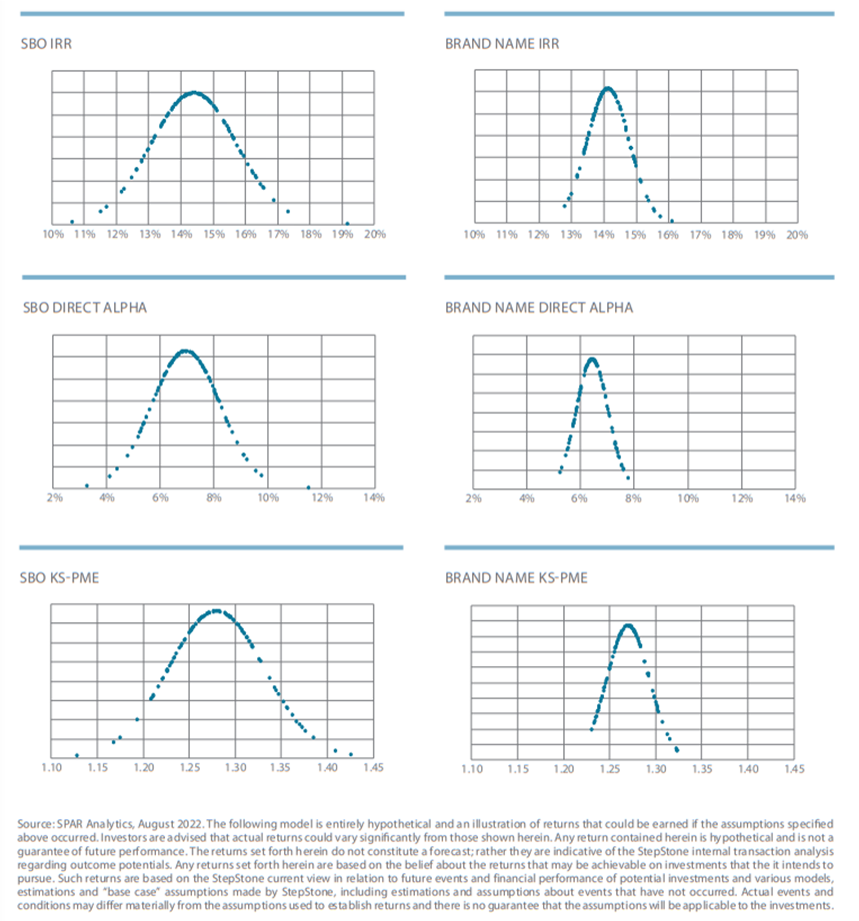
We examined buyout funds raised between 1985 and 2021. We defined brand-name funds as those whose fund sizes were in the top tercile (67th percentile) for a given vintage; SBO funds as those whose fund sizes were in the bottom tercile (33rd percentile). We created 100 portfolios made up of 10 funds by randomly selecting five of each fund type. To approximate hypothetical median performance—and avoid overweighting a good vintage or a poor fund—we also equally weighted vintages as well as commitments in each. We measured hypothetical performance across three dimensions: IRR, Direct Alpha, and Kaplan Schoar PME. The hypothetical results are summarized in Figure 14.[7]
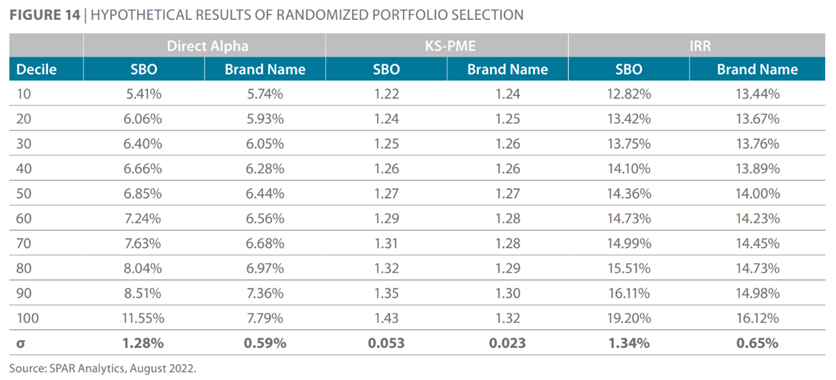
To help answer our question, we calculated the standard deviation (σ) of each measure. Harkening back to SBO’s return dispersion, it should come as no surprise that SBO had a higher σ. But this wide distribution isn’t necessarily bad: We found that a 1σ increase in SBO’s IRR is roughly equivalent to a 1.3σ increase in brand names.[8] In other words, the marginal return on effort is higher for SBO.
Think of this as an optimization exercise. In a world of limited time and money, we must choose how to spend either. Suppose a family office CIO must choose between randomly selecting one type of fund and spending resources vetting another. Clearly, they should randomly pick from the pool of brand-name managers where the marginal returns of climbing to the next decile are lower, and the risks of picking poorly are less pronounced. In assembling an SBO portfolio, a CIO needn’t even aim for the top quartile; if they can get to the 40th percentile, their time and energy will have been well spent.
Conclusion
As family offices ponder the composition of their portfolios for 2023, they may feel tempted to flock to familiar managers at the upper end of the market. Based on the data, we would say: Fight the urge! We believe now is the time to lean in to SBO. Less competition, attractive entry valuations, lower leverage, dry powder upmarket, multiple arbitrage, and a low correlation with stock market volatility are several reasons why. Regardless of market cycles, SBO can play a central role in a family office’s portfolio, complementing other private equity strategies by providing alternative return drivers and diversification benefits. Moreover, cutting back on SBO disproportionately affects capital going to diverse and emerging managers. However, family offices choose to proceed, we believe investing in SBO to be well worth the effort. And there is no better time than now.
Marc J. Sharpe is the founder and Chairman of The Family Office Association ("TFOA"), an organization formed in 2007 to provide a forum for education and networking and to serve as a resource for single family office principals and professionals to share ideas and best practices, pool buying power, leverage talent and conduct due diligence. Mr. Sharpe is active in the community and has served on the Board of the Holocaust Museum Houston, the HBS Houston Angels, and on the Investment Committee for two Texas based foundations. Contact: marc@tfoatx.com
Appendix A | Peak-to-Trough Performance
Appendix B | Hypothetical Results
Disclosures
The Family Office Association ("TFOA") is a peer network of Single Family Offices. Our community is intended to provide members with educational information and a forum in which to exchange information of mutual interest. TFOA does not participate in the offer, sale or distribution of any securities nor does it provide investment advice. Further, TFOA does not provide tax, legal or financial advice. Materials distributed by TFOA are provided for informational purposes only and shall not be construed to be a recommendation to buy or sell securities or a recommendation to retain the services of any investment adviser or other professional adviser. The identification or listing of products, services, links, or other information does not constitute or imply any warranty, endorsement, guaranty, sponsorship, affiliation, or recommendation by TFOA. Any investment decisions you may make based on any information provided by TFOA is your sole responsibility. The TFOA logo and all related product and service names, designs, and slogans are the trademarks or service marks of The Family Office Association. All other product and service marks on materials provided by TFOA are the trademarks of their respective owners. All of the intellectual property rights of TFOA or its contributors remain the property of TFOA or such contributor, as the case may be, such rights may be protected by United States and international laws and none of such rights are transferred to you as a result of such material appearing on the TFOA web site. The information presented by TFOA has been obtained by TFOA from sources it believes are reliable. However, TFOA does not guarantee the accuracy or completeness of any such information. All such information has been prepared and provided solely for general informational purposes and is not intended as user specific advice.
This document is for information purposes only and has been compiled with publicly available information. StepStone makes no guarantees of the accuracy of the information provided. This information is for the use of StepStone’s clients and contacts only. This report is only provided for informational purposes. This report may include information that is based, in part or in full, on assumptions, models and/or other analysis (not all of which may be described herein). StepStone makes no representation or warranty as to the reasonableness of such assumptions, models or analysis or the conclusions drawn. Any opinions expressed herein are current opinions as of the date hereof and are subject to change at any time. StepStone is not intending to provide investment, tax or other advice to you or any other party, and no information in this document is to be relied upon for the purpose of making or communicating investments or other decisions. Neither the information nor any opinion expressed in this report constitutes a solicitation, an offer, or a recommendation to buy, sell or dispose of any investment, to engage in any other transaction or to provide any investment advice or service.
Past performance is not a guarantee of future results. Actual results may vary.
On September 20, 2021, StepStone Group Inc. acquired Greenspring Associates, Inc. (“Greenspring”). Upon the completion of this acquisition, the management agreement of each Greenspring vehicle was assigned to StepStone Group LP. Each of StepStone Group LP, StepStone Group Real Assets LP, StepStone Group Real Estate LP and StepStone Group Private Wealth LLC is an investment adviser registered with the Securities and Exchange Commission (“SEC”). StepStone Group Europe LLP is authorized and regulated by the Financial Conduct Authority, firm reference number 551580. StepStone Group Europe Alternative Investments Limited (“SGEAIL”) is an SEC Registered Investment Advisor and an Alternative Investment Fund Manager authorized by the Central Bank of Ireland and Swiss Capital Alternative Investments AG (“SCAI”) is an SEC Exempt Reporting Adviser and is licensed in Switzerland as an Asset Manager for Collective Investment Schemes by the Swiss Financial Markets Authority FINMA. Such registrations do not imply a certain level of skill or training and no inference to the contrary should be made.
In relation to Switzerland only, this document may qualify as “advertising” in terms of Art. 68 of the Swiss Financial Services Act (FinSA). To the extent that financial instruments mentioned herein are offered to investors by SCAI, the prospectus/offering document and key information document (if applicable) of such financial instrument(s) can be obtained free of charge from SCAI or from the GP or investment manager of the relevant collective investment scheme(s). Further information about SCAI is available in the SCAI Information Booklet which is available from SCAI free of charge. Manager references herein are for illustrative purposes only and do not constitute investment recommendations.
[1] Downside is defined as the maximum drawdown between the peak and trough during a crisis; upside is the annualized return between the trough of the previous crisis and the peak of the next crisis. Dot-com peak March 31, 2000, trough September 30, 2002; GFC peak September 30, 2007, trough March 31, 2009; Covid peak December 31, 2019, trough March 31, 2020; post-Covid peak September 30, 2021.
[2]In our view, to be diverse, funds must pass at least one of the following tests: One-third of ownership counts as diverse; one-third of carry goes to diverse individuals; or one-third of individuals covered by a fund’s key-person clause are diverse.
[3]As of September 30, 2022. StepStone Private Markets Intelligence, Stepstone’s proprietary research library, garnered data on more than 15,000 GPs, 40,000 funds and 180,000 investments.
[4] We define new managers as those raising a Fund I; emerging managers as those raising Funds II–III.
[5] National Association of Investment Companies. 2021. “Examining the Returns 2021: The Financial Returns of Diverse Private Equity Firms.”
[6] StepStone Portfolio Analytics & Reporting. 2022. Omni Fund Benchmark, June 30.
[7] The following model is entirely hypothetical and an illustration of returns that could be earned if the assumptions specified above occurred. Investors are advised that actual returns could vary significantly from those shown herein. Any return contained herein is hypothetical and is not a guarantee of future performance. The returns set forth herein do not constitute a forecast; rather they are indicative of the StepStone internal transaction analysis regarding outcome potentials. Any returns set forth herein are based on the beliefabout the returnsthat may be achievable on investments that it intendsto pursue. Such returns are based on the StepStone current view in relation to future events and financial performance of potential investments and various models, estimations and “base case” assumptions made by StepStone, including estimations and assumptions about events that have not occurred. Actual events and conditions may differ materially from the assumptions used to establish returns and there is no guarantee that the assumptions will be applicable to the investments. Refer to the appendix for graphical summaries of the analysis.
[8] This observation holds for the other measures as well. A 1σ increase in SBO was roughly equivalent to a 1.1σ increase in brand-name Direct Alpha and a 1.2σ increase in brand-name KS-PME.